
About the school
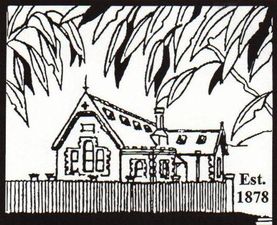
Canterbury Public School was first established in 1878 and features heritage buildings set in spacious grounds, providing students with a pleasant play environment. The school has extensive classroom space, including a modern library, networked computers in classrooms, and computer labs. It serves a culturally diverse community with an enrolment of approximately 320 students, including 57% from a non-English speaking background, 4% Aboriginal or Torres Strait Islander students, and a special education support unit comprising five classes. The school community is enthusiastic and committed, emphasising quality teaching and a strong focus on effective literacy and numeracy education.
Student Well-being and Engagement
Student engagement and social-emotional well-being are priorities at Canterbury Public School, supported by extensive programs in the arts, restorative practice, environmental education, Indigenous education, public speaking and debating, technology, and sport. The school is dedicated to innovative integration of technology across all key learning areas, ensuring students develop the necessary skills for the future. Canterbury Public School prides itself on knowing and valuing every student and family while offering a full range of quality learning programs and resources.
Commitment to Community
The school community celebrates diversity and strives for excellence, equity, and participation to ensure the holistic development of every child. Several values developed by the whole school community drive its operational ethos, including fostering a positive and successful learning environment, supporting and respecting each other, and encouraging lifelong learning. The community actively works together to ensure effective communication and shared decision-making, embracing diversity and recognising the strengths of all members.
With strong links to local high schools, Canterbury Public School ensures continuity in education for its students.
Mission
Canterbury Public School's vision is to work in partnership with the school community to: challenge, inspire and support every child to reach their potential and embrace learning as an active and creative lifelong pursuit; equip students with the skills, values, understandings and efficacy to have choice and opportunity in future education, employment and life and be happy and successful in an ever-changing and complex world; nurture confident, informed and community-minded citizens with a strong sense of identity, belonging and social responsibility in an inclusive environment.
Location & Catchment Area
- Canterbury Public School
Nearby or Connected Schools
- A Canterbury Girls High School 169 m
- B Canterbury Boys High School 530 m
- C Yeo Park Infants School 983 m
- D Edgeware School 991 m
- E Ashbury Public School 1.1 km
- F Canterbury South Public School 1.2 km
- G Campsie Public School 1.6 km
- H Dulwich Hill Public School 1.7 km
- I Summer Hill Public School 1.9 km
- J Croydon Park Public School 2.0 km
- K Dulwich High School of Visual Arts and Design 2.1 km
- L Ashfield Public School 2.2 km
Profile (2025)
- Total enrolments
- 346 (154 girls, 192 boys)
- Enrolments (FTE) What does this mean?
- 346
- ICSEA What does this mean?
- 1082 (percentile 79)
- SEA quarters What does this mean?
- 11% / 19% / 35% / 34%
- FOEI What does this mean?
- 34
- Indigenous students
- 3%
- LBOTE What does this mean?
- 51%
- Teaching staff (FTE) What does this mean?
- 24.7
- Non-teaching staff (FTE) What does this mean?
- 7.9
Enrolments by grade (2025)
| Grade | Headcount |
|---|---|
| Kindergarten | 47 |
| Year 1 | 51 |
| Year 2 | 50 |
| Year 3 | 38 |
| Year 4 | 50 |
| Year 5 | 51 |
| Year 6 | 59 |
| Total | 346 |
Year by year
Attendance data for 2020 is unavailable — NSW schools were disrupted by COVID-19 and the Department of Education did not publish figures for that year.
| Year | Enrolments | Girls | Boys | Attendance % | ICSEA | Teaching staff (FTE) |
|---|---|---|---|---|---|---|
| 2025 | 346 | 154 | 192 | - | 1082 | 24.7 |
| 2024 | 348 | 146 | 202 | 91.3 | 1068 | 24.9 |
| 2023 | 349 | 151 | 198 | 92.7 | 1065 | 23.6 |
| 2022 | 370 | 170 | 200 | 89.4 | 1061 | 24.9 |
| 2021 | 369 | 175 | 194 | 93.6 | 1059 | 25.8 |
| 2020 | 387 | 178 | 209 | - | 1058 | 33.4 |
| 2019 | 369 | 178 | 191 | 93.7 | 1061 | 32.4 |
| 2018 | 367 | 180 | 187 | 93.7 | 1028 | 31.1 |
| 2017 | 330 | 159 | 171 | 94.8 | 1041 | 30.6 |
| 2016 | 307 | 150 | 157 | 93.5 | 1059 | 28.4 |
| 2015 | 260 | 123 | 137 | 93.4 | 1066 | 25.9 |
| 2014 | 255 | 124 | 131 | 94.7 | 1066 | 25 |
| 2013 | 260 | 131 | 129 | 94.9 | 1059 | 24.7 |
| 2012 | 255 | 129 | 126 | 94.2 | 1080 | 27.7 |
| 2011 | 264 | 124 | 140 | 94.3 | 1080 | 28.5 |
| 2010 | 270 | 118 | 152 | - | 1091 | 27.7 |
| 2009 | 266 | 122 | 144 | - | 1047 | 28 |
| 2008 | 291 | 128 | 163 | - | 1047 | 29.2 |
Attendance data for 2020 is unavailable — NSW schools were disrupted by COVID-19 and the Department of Education did not publish figures for that year.