
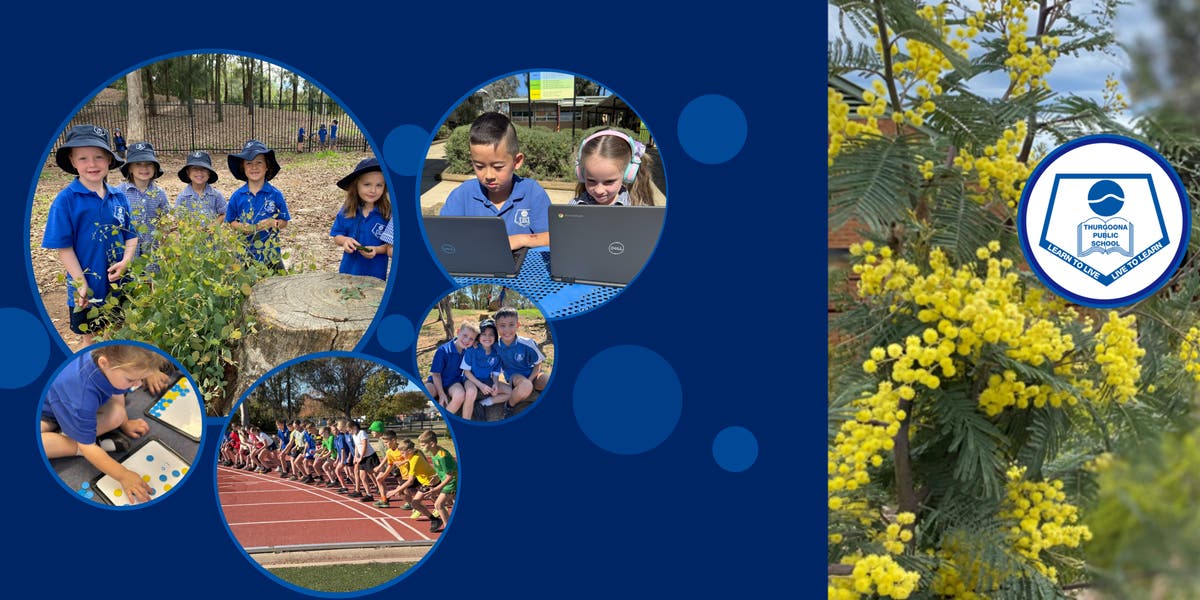
About the school
Thurgoona Public School develops excellence, innovation, opportunity, and student success in a caring environment. It provides a friendly, nurturing, and supportive learning environment that values partnerships with parents and the wider community. Quality education programs are delivered by experienced, dedicated teachers and enthusiastic support staff. The school runs highly successful transition programs in conjunction with prior-to-school settings and partnership schools, fostering student confidence and self-esteem. Effective student welfare and support programs, as well as discipline programs, help develop personal and social responsibility and are tailored to meet individual learning needs.
Curriculum and Opportunities
Thurgoona Public School offers varied opportunities through an extensive curriculum that encompasses enrichment activities. The school encourages success in academic endeavours, sport, and the performing arts. A strong academic focus on the development of IT and computer skills is actively supported at each stage level. As a member of the Northern Spirit Learning Community, the school was recognised with a Special Commendation in the 2009 Cohesive School Community Award, which focuses on social harmony and unity. With a commitment to continuous improvement, Thurgoona Public School ensures every child receives the right support and challenge needed to develop their skills and confidence. The welcoming and inclusive community promotes respect and celebrates diversity among its students.
Mission
Our school culture is focused on equipping students to become successful lifelong learners in a safe, respectful environment.
Location & Catchment Area
- Thurgoona Public School
Nearby or Connected Schools
- A Lavington East Public School 3.2 km
- B Hume Public School 3.3 km
- C Springdale Heights Public School 3.5 km
- D Murray High School 3.6 km
- E Albury North Public School 4.9 km
- F Wewak Street School 5.0 km
Profile (2025)
- Total enrolments
- 573 (250 girls, 323 boys)
- Enrolments (FTE) What does this mean?
- 573
- ICSEA What does this mean?
- 990 (percentile 42)
- SEA quarters What does this mean?
- 35% / 34% / 21% / 11%
- FOEI What does this mean?
- 91
- Indigenous students
- 11%
- LBOTE What does this mean?
- 14%
- Teaching staff (FTE) What does this mean?
- 33.9
- Non-teaching staff (FTE) What does this mean?
- 5.1
Enrolments by grade (2025)
| Grade | Headcount |
|---|---|
| Kindergarten | 80 |
| Year 1 | 81 |
| Year 2 | 84 |
| Year 3 | 88 |
| Year 4 | 86 |
| Year 5 | 80 |
| Year 6 | 74 |
| Total | 573 |
Year by year
Attendance data for 2020 is unavailable — NSW schools were disrupted by COVID-19 and the Department of Education did not publish figures for that year.
| Year | Enrolments | Girls | Boys | Attendance % | ICSEA | Teaching staff (FTE) |
|---|---|---|---|---|---|---|
| 2025 | 573 | 250 | 323 | - | 990 | 33.9 |
| 2024 | 620 | 286 | 334 | 90.7 | 992 | 34.9 |
| 2023 | 627 | 307 | 320 | 89.7 | 991 | 35 |
| 2022 | 617 | 308 | 309 | 88.1 | 998 | 34.5 |
| 2021 | 599 | 308 | 291 | 92.3 | 1010 | 32.8 |
| 2020 | 595 | 295 | 300 | - | 1013 | 32.8 |
| 2019 | 588 | 292 | 296 | 94.3 | 1015 | 32.7 |
| 2018 | 575 | 280 | 295 | 94 | 999 | 31.4 |
| 2017 | 492 | 228 | 264 | 94.5 | 1001 | 26.6 |
| 2016 | 438 | 205 | 233 | 94 | 1001 | 23.3 |
| 2015 | 407 | 193 | 214 | 94.3 | 996 | 21.2 |
| 2014 | 402 | 180 | 222 | 95 | 1001 | 20.8 |
| 2013 | 361 | 174 | 187 | 95.2 | 1002 | 18.7 |
| 2012 | 371 | 170 | 201 | 93.9 | 995 | 19.1 |
| 2011 | 360 | 173 | 187 | 93.9 | 988 | 18.1 |
| 2010 | 374 | 175 | 199 | - | 984 | 18.1 |
| 2009 | 361 | 178 | 183 | - | 1007 | 19.3 |
| 2008 | 357 | 184 | 173 | - | 1007 | 19.2 |
Attendance data for 2020 is unavailable — NSW schools were disrupted by COVID-19 and the Department of Education did not publish figures for that year.