
Maroubra Bay Public School
Where every child is known, valued and cared for.
About the school
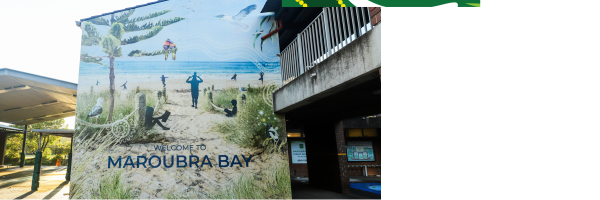
At Maroubra Bay Public School, every child is known, valued and cared for within a vibrant learning environment. This school fosters high expectations among its students, encouraging them to become successful and independent learners. Maroubra Bay has a proud history of achievement in the creative arts, featuring initiatives such as whole school ballroom dancing programs and an artist in residence. The school is situated in a flourishing community and boasts colourful grounds, contributing to a strong sense of student cohesion.
Commitment to Learning
The school's mission emphasises quality education through an innovative and challenging curriculum. With a focus on measurable student growth, the school aims to improve outcomes in areas such as NAPLAN reading and numeracy while fostering a holistic approach to wellbeing. Programs like Grow Your Mind and BounceBack are integral in supporting both students and staff, ensuring a nurturing environment.
Community Engagement
Maroubra Bay Public School is dedicated to creating a supportive community involving parents, carers, and local groups. It actively engages with families to co-design plans that enable student learning success and build a sense of belonging. The school offers tailored learning support to meet diverse needs, including those of gifted students and those requiring additional assistance.
Facilities and Resources
The school facilities enhance the educational experience, with modern classrooms designed to provide a healthy and stimulating environment. Maroubra Bay keeps pace with technological advancements and educational trends, ensuring that students have access to the best possible resources for learning.
Mission
Maroubra Bay Public School provides quality education for our students through an innovative, challenging and vibrant learning environment that inspires learning.
Location & Catchment Area
- Maroubra Bay Public School
Nearby or Connected Schools
- A South Coogee Public School 1.2 km
- B Maroubra Junction Public School 1.5 km
- C South Sydney High School 1.7 km
- D Matraville Soldiers Settlement Public School 1.9 km
- E Malabar Public School 2.0 km
- F Matraville Sports High School 2.4 km
- G Matraville Public School 2.5 km
- H Chifley Public School 2.6 km
- I Coogee Public School 2.6 km
- J Rainbow Street Public School 2.6 km
- K Randwick High School 2.8 km
- L Daceyville Public School 2.8 km
Profile (2025)
- Total enrolments
- 269 (138 girls, 131 boys)
- Enrolments (FTE) What does this mean?
- 269
- ICSEA What does this mean?
- 1055 (percentile 70)
- SEA quarters What does this mean?
- 18% / 19% / 29% / 34%
- FOEI What does this mean?
- 69
- Indigenous students
- 11%
- LBOTE What does this mean?
- 40%
- Teaching staff (FTE) What does this mean?
- 16.4
- Non-teaching staff (FTE) What does this mean?
- 2.6
Enrolments by grade (2025)
| Grade | Headcount |
|---|---|
| Kindergarten | 29 |
| Year 1 | 25 |
| Year 2 | 27 |
| Year 3 | 42 |
| Year 4 | 55 |
| Year 5 | 38 |
| Year 6 | 53 |
| Total | 269 |
Year by year
Attendance data for 2020 is unavailable — NSW schools were disrupted by COVID-19 and the Department of Education did not publish figures for that year.
| Year | Enrolments | Girls | Boys | Attendance % | ICSEA | Teaching staff (FTE) |
|---|---|---|---|---|---|---|
| 2025 | 269 | 138 | 131 | - | 1055 | 16.4 |
| 2024 | 310 | 155 | 155 | 89.6 | 1059 | 17.7 |
| 2023 | 359 | 172 | 187 | 91 | 1066 | 20.4 |
| 2022 | 406 | 199 | 207 | 88 | 1072 | 22.5 |
| 2021 | 429 | 208 | 221 | 94.1 | 1075 | 24.4 |
| 2020 | 397 | 190 | 207 | - | 1071 | 22 |
| 2019 | 371 | 171 | 200 | 92.5 | 1075 | 21.5 |
| 2018 | 364 | 175 | 189 | 93.6 | 1081 | 21.2 |
| 2017 | 320 | 158 | 162 | 93.4 | 1061 | 18.8 |
| 2016 | 318 | 145 | 173 | 93.2 | 1070 | 18.5 |
| 2015 | 305 | 150 | 155 | 90.5 | 1073 | 18.6 |
| 2014 | 263 | 134 | 129 | 93 | 1062 | 16 |
| 2013 | 205 | 106 | 99 | 93.6 | 1084 | 14.1 |
| 2012 | 188 | 96 | 92 | 90.1 | 1073 | 12.6 |
| 2011 | 161 | 85 | 76 | 91.7 | 1085 | 11.6 |
| 2010 | 134 | 69 | 65 | - | 1085 | 9 |
| 2009 | 105 | 53 | 52 | - | 979 | 7.9 |
| 2008 | 86 | 40 | 46 | - | 979 | 6.4 |
Attendance data for 2020 is unavailable — NSW schools were disrupted by COVID-19 and the Department of Education did not publish figures for that year.