
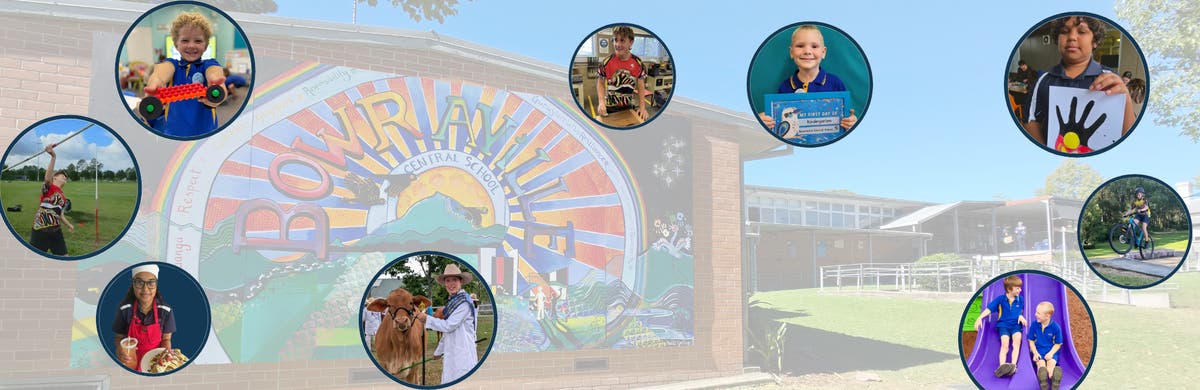
Bowraville Central School
Together we live, together we connect, together we learn, together we grow so that together we thrive.
About the school
Bowraville Central School is a Kindergarten to Year 12 campus located in the Nambucca Valley on the Mid-North Coast of NSW. This school serves a diverse community and prioritises creating a safe and nurturing learning environment. With a proud history dating back to 1875, the school has evolved significantly, culminating in its first Year 12 cohort completing their Higher School Certificate in 2008. Recently, Bowraville Central School underwent a $6,000,000 capital works upgrade, which has expanded and enriched its curriculum offerings.
The school features a dedicated two-hectare farm which supports its Primary Industries program. Additional vocational education and training (VET) courses available include Hospitality, Metals and Engineering, and Construction. Bowraville Central School is keenly focused on community engagement and has established a well-regarded Gumbaynggirr Program, designed to teach students about local Aboriginal language and culture, developed in partnership with Muurrbay Language Centre.
As a Connected Communities school, Bowraville Central places strong emphasis on collaboration with the local community to ensure the best possible educational outcomes for all students, including those from Aboriginal backgrounds. The school's vision encapsulates a philosophy of mutual growth and connection: 'Together we live, together we connect, together we learn, together we grow so that together we thrive.'
Mission
Together we live, together we connect, together we learn, together we grow so that together we thrive.
Location & Catchment Area
- Bowraville Central School
Catchment zones
Nearby or Connected Schools
- A Macksville Public School 9.2 km
- B Macksville High School 9.8 km
- C Nambucca Heads High School 12.5 km
- D Frank Partridge VC Public School 12.7 km
Profile (2025)
- Total enrolments
- 207 (102 girls, 105 boys)
- Enrolments (FTE) What does this mean?
- 206.2
- ICSEA What does this mean?
- 861 (percentile 6)
- SEA quarters What does this mean?
- 69% / 23% / 7% / 1%
- FOEI What does this mean?
- 156
- Indigenous students
- 33%
- LBOTE What does this mean?
- 7%
- Teaching staff (FTE) What does this mean?
- 24.8
- Non-teaching staff (FTE) What does this mean?
- 12.8
Enrolments by grade (2025)
| Grade | Headcount |
|---|---|
| Kindergarten | 22 |
| Year 1 | 17 |
| Year 2 | 14 |
| Year 3 | 16 |
| Year 4 | 10 |
| Year 5 | 14 |
| Year 6 | 14 |
| Year 7 | 28 |
| Year 8 | 27 |
| Year 9 | 17 |
| Year 10 | 20 |
| Year 11 | 5 |
| Year 12 | 3 |
| Total | 207 |
Year by year
Attendance data for 2020 is unavailable — NSW schools were disrupted by COVID-19 and the Department of Education did not publish figures for that year.
| Year | Enrolments | Girls | Boys | Attendance % | ICSEA | Teaching staff (FTE) |
|---|---|---|---|---|---|---|
| 2025 | 207 | 102 | 105 | - | 861 | 24.8 |
| 2024 | 162 | 87 | 75 | 78.8 | 863 | 28 |
| 2023 | 151 | 73 | 78 | 76 | 844 | 28 |
| 2022 | 155 | 70 | 85 | 79.2 | 835 | 26.6 |
| 2021 | 159 | 73 | 86 | 78.4 | 838 | 26.1 |
| 2020 | 179 | 85 | 94 | - | 843 | 24.3 |
| 2019 | 185 | 83 | 102 | 79.9 | 841 | 25.4 |
| 2018 | 213 | 95 | 118 | 80.1 | 862 | 24.7 |
| 2017 | 230 | 112 | 118 | 86.9 | 838 | 22.3 |
| 2016 | 255 | 126 | 129 | 86.8 | 841 | 23.5 |
| 2015 | 240 | 113 | 127 | 86.3 | 845 | 23.5 |
| 2014 | 241 | 107 | 134 | 88.6 | 875 | 22.5 |
| 2013 | 253 | 115 | 138 | 89.1 | 875 | 23.6 |
| 2012 | 230 | 97 | 133 | 86.9 | 873 | 21.9 |
| 2011 | 229 | 92 | 137 | 87.2 | 867 | 22.8 |
| 2010 | 245 | 100 | 145 | - | 887 | 23.6 |
| 2009 | 262 | 112 | 150 | - | 899 | 23.6 |
| 2008 | 275 | 115 | 160 | - | 899 | 23.8 |
Attendance data for 2020 is unavailable — NSW schools were disrupted by COVID-19 and the Department of Education did not publish figures for that year.