
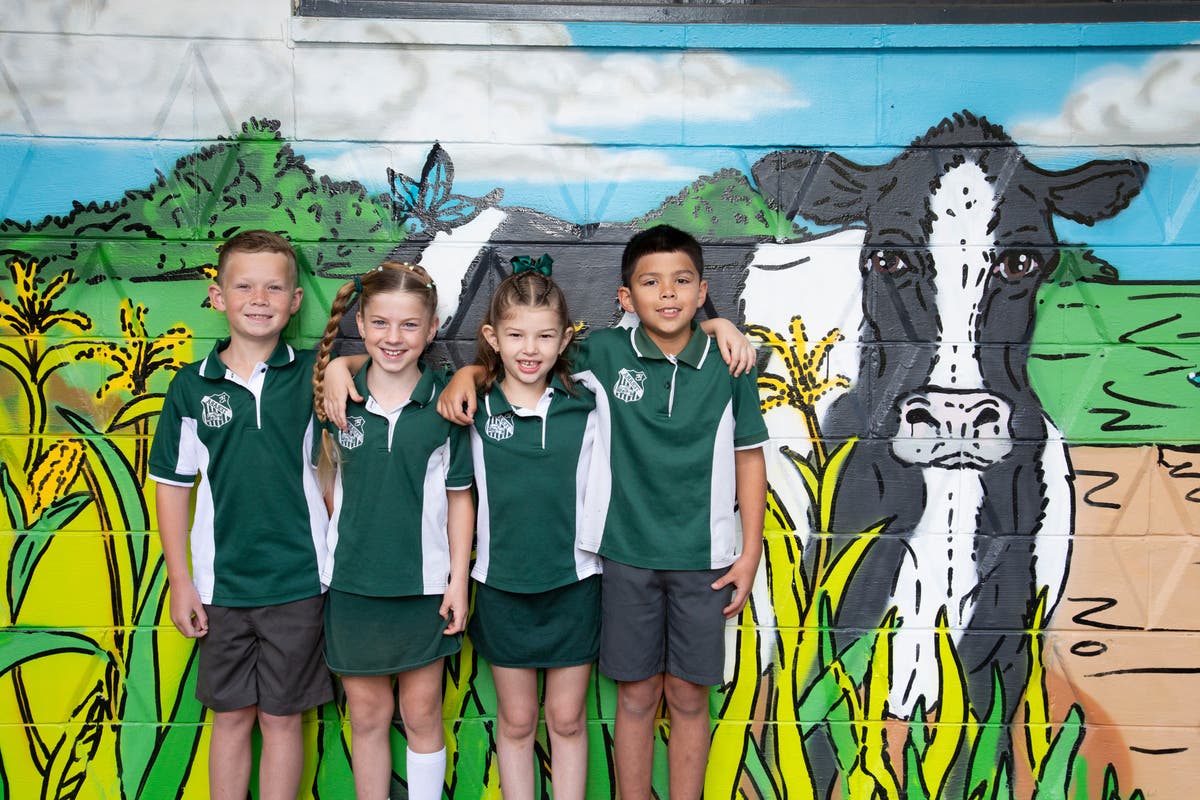
About the school
Terara Public School has been providing a quality education for its students for 130 years. The school's heritage-listed buildings are set amongst beautiful established grounds, creating a friendly and supportive learning environment. Innovative programs and dedicated staff enable students to achieve high academic standards. The school places a strong focus on technology and delivers successful literacy and numeracy programs while offering a range of extra-curricular activities for students.
The welcoming and friendly school community is built on strong cooperative relationships between staff, students, and parents, where all are encouraged to be involved. Opportunities for students to expand on and demonstrate their leadership skills are abundant, alongside a strong focus on developing positive values and social responsibility. The safe, nurturing learning environment promotes the school's core values of respect, responsibility, safety, and achievement.
Mission
We help every student to learn, grow and succeed. Join our friendly and inclusive school community today!
Location & Catchment Area
- Terara Public School
Nearby or Connected Schools
- A Nowra High School 2.0 km
- B Nowra East Public School 2.7 km
- C Bomaderry Public School 2.9 km
- D Nowra Public School 3.1 km
- E Bomaderry High School 3.6 km
- F Illaroo Road Public School 3.8 km
- G Shoalhaven High School 3.9 km
Profile (2025)
- Total enrolments
- 96 (53 girls, 43 boys)
- Enrolments (FTE) What does this mean?
- 96
- ICSEA What does this mean?
- 1009 (percentile 51)
- SEA quarters What does this mean?
- 24% / 42% / 25% / 9%
- FOEI What does this mean?
- 86
- LBOTE What does this mean?
- 7%
- Teaching staff (FTE) What does this mean?
- 5.2
- Non-teaching staff (FTE) What does this mean?
- 1.4
Enrolments by grade (2025)
| Grade | Headcount |
|---|---|
| Kindergarten | 17 |
| Year 1 | 13 |
| Year 2 | 12 |
| Year 3 | 14 |
| Year 4 | 14 |
| Year 5 | 14 |
| Year 6 | 12 |
| Total | 96 |
Year by year
Attendance data for 2020 is unavailable — NSW schools were disrupted by COVID-19 and the Department of Education did not publish figures for that year.
| Year | Enrolments | Girls | Boys | Attendance % | ICSEA | Teaching staff (FTE) |
|---|---|---|---|---|---|---|
| 2025 | 96 | 53 | 43 | - | 1009 | 5.2 |
| 2024 | 96 | 53 | 43 | 90.6 | 1014 | 5.2 |
| 2023 | 90 | 50 | 40 | 92.1 | 997 | 5.2 |
| 2022 | 93 | 56 | 37 | 87.5 | 989 | 5.1 |
| 2021 | 89 | 48 | 41 | 94.8 | 993 | 5.1 |
| 2020 | 92 | 50 | 42 | - | 1000 | 5.1 |
| 2019 | 94 | 49 | 45 | 94 | 1001 | 5.1 |
| 2018 | 92 | 47 | 45 | 94.7 | 993 | 5.1 |
| 2017 | 88 | 50 | 38 | 94.5 | 999 | 5.3 |
| 2016 | 79 | 48 | 31 | 94.6 | 993 | 4.8 |
| 2015 | 85 | 46 | 39 | 95.3 | 1001 | 4.9 |
| 2014 | 83 | 49 | 34 | 95.8 | 980 | 5.2 |
| 2013 | 85 | 46 | 39 | 95.9 | 998 | 4.9 |
| 2012 | 82 | 42 | 40 | 96 | 975 | 5.1 |
| 2011 | 87 | 49 | 38 | 95.7 | 971 | 5.2 |
| 2010 | 84 | 45 | 39 | - | 969 | 4.7 |
| 2009 | 85 | 49 | 36 | - | 1006 | 4.7 |
| 2008 | 89 | 47 | 42 | - | 1006 | 4.7 |
Attendance data for 2020 is unavailable — NSW schools were disrupted by COVID-19 and the Department of Education did not publish figures for that year.