
About the school
Kingscliff Public School has a proud history of providing quality education to ensure a solid foundation of learning for its students. The school places a strong emphasis on literacy, numeracy, and the effective use of technology across all classes. It offers a variety of co-curricular programs that promote high student engagement and success in academic, cultural, environmental, and sports activities. Commitment to physical fitness and a healthy lifestyle is encouraged among students.
The school fosters a friendly community that values social skills, leadership, and citizenship. It encourages students to engage in learning, achieve success, receive recognition, express their feelings respectfully, and develop self-discipline. The core values of Kingscliff Public School align with those of New South Wales Public Schools, which include Integrity, Excellence, Respect, Responsibility, Cooperation, Participation, Care, Fairness, and Democracy.
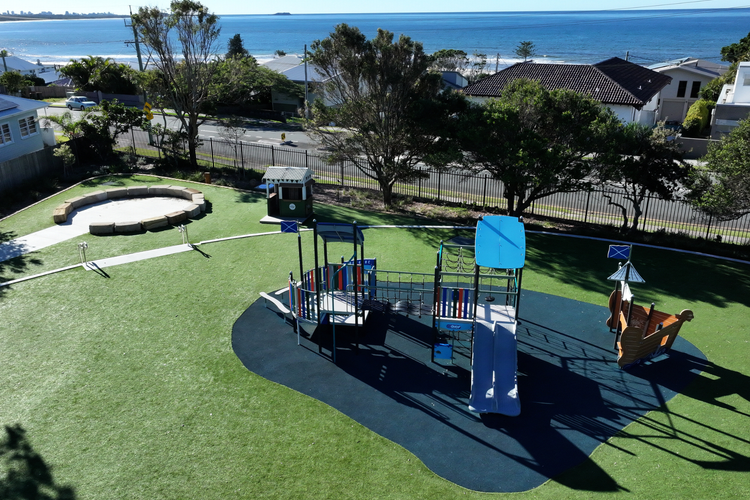
Community partnerships are a significant aspect of the school's tradition, with involvement in activities such as ANZAC Day commemorations and local performances. Kingscliff Public School provides a welcoming environment for students, staff, and parents, facilitating collaboration and support within the school community. The school's recent upgrade has introduced modern facilities aimed at enhancing the learning experience, ensuring Kingscliff Public School remains a vibrant and engaging place for students to thrive.
Mission
Kingscliff Public School fosters an inclusive and nurturing environment with high expectations, encouraging students to grow into independent, resilient, and lifelong learners.
Location & Catchment Area
- Kingscliff Public School
Nearby or Connected Schools
- A Kingscliff High School 1.2 km
- B Cudgen Public School 2.4 km
- C Banora Point Public School 5.4 km
- D Duranbah Public School 7.0 km
Profile (2025)
- Total enrolments
- 455 (206 girls, 249 boys)
- Enrolments (FTE) What does this mean?
- 455
- ICSEA What does this mean?
- 1058 (percentile 71)
- SEA quarters What does this mean?
- 15% / 26% / 28% / 30%
- FOEI What does this mean?
- 64
- Indigenous students
- 10%
- LBOTE What does this mean?
- 11%
- Teaching staff (FTE) What does this mean?
- 33.3
- Non-teaching staff (FTE) What does this mean?
- 4.1
Enrolments by grade (2025)
| Grade | Headcount |
|---|---|
| Kindergarten | 54 |
| Year 1 | 72 |
| Year 2 | 58 |
| Year 3 | 66 |
| Year 4 | 73 |
| Year 5 | 67 |
| Year 6 | 65 |
| Total | 455 |
Year by year
Attendance data for 2020 is unavailable — NSW schools were disrupted by COVID-19 and the Department of Education did not publish figures for that year.
| Year | Enrolments | Girls | Boys | Attendance % | ICSEA | Teaching staff (FTE) |
|---|---|---|---|---|---|---|
| 2025 | 455 | 206 | 249 | - | 1058 | 33.3 |
| 2024 | 426 | 184 | 242 | 89.5 | 1062 | 33.3 |
| 2023 | 427 | 184 | 243 | 90.3 | 1048 | 32.1 |
| 2022 | 475 | 227 | 248 | 88.4 | 1048 | 31.7 |
| 2021 | 507 | 236 | 271 | 91.1 | 1039 | 31.7 |
| 2020 | 569 | 260 | 309 | - | 1036 | 31.7 |
| 2019 | 618 | 284 | 334 | 92.5 | 1038 | 32.7 |
| 2018 | 609 | 284 | 325 | 94.2 | 1042 | 32.5 |
| 2017 | 624 | 294 | 330 | 93.1 | 1044 | 32.9 |
| 2016 | 573 | 271 | 302 | 92.8 | 1044 | 29.7 |
| 2015 | 535 | 262 | 273 | 94 | 1044 | 28.2 |
| 2014 | 509 | 248 | 261 | 94.2 | 1050 | 24.9 |
| 2013 | 486 | 234 | 252 | 93.6 | 1047 | 24.9 |
| 2012 | 468 | 230 | 238 | 94.2 | 1034 | 23.4 |
| 2011 | 474 | 239 | 235 | 94.8 | 1031 | 22.4 |
| 2010 | 436 | 214 | 222 | - | 1036 | 22.4 |
| 2009 | 439 | 217 | 222 | - | 1009 | 22.4 |
| 2008 | 393 | 191 | 202 | - | 1009 | 20.4 |
Attendance data for 2020 is unavailable — NSW schools were disrupted by COVID-19 and the Department of Education did not publish figures for that year.