
Duranbah Public School
A quality education in a caring environment.
About the school
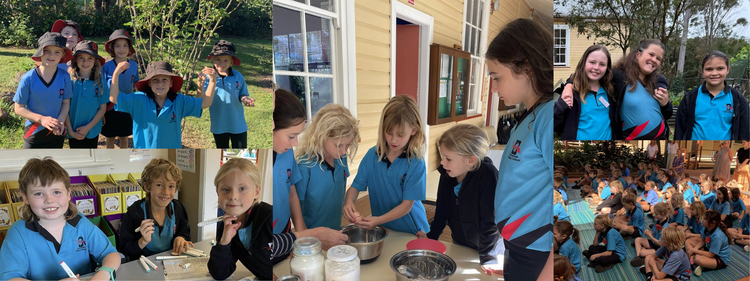
Duranbah Public School is located eight kilometres west of Kingscliff, nestled in a picturesque rainforest environment. The school's classrooms are well-resourced, providing stimulating learning experiences for students. Literacy and Numeracy are at the core of the curriculum, complemented by a commitment to developing competent, responsible, and enthusiastic learners through relevant and challenging activities. The school fosters an environment that encourages independent learning, self-esteem, tolerance, and self-discipline within a safe and harmonious setting.
The dedicated and caring staff at Duranbah Public School value quality education and believe in the importance of student welfare, parent involvement, and open communication. Students are actively encouraged to partake in a wide array of academic, leadership, cultural, sporting, and social activities, engaging with peers both locally and beyond. Duranbah is proud to be a member of the Coastal Learning Community and S7 Small Schools group, benefiting from shared learning experiences with neighbouring schools.
The school enjoys a strong reputation within the community for its celebration of diversity, encompassing various ages, cultures, religions, and abilities. This commitment to inclusivity helps create a vibrant and supportive environment for all students, ensuring that each child feels valued and inspired to learn.
Mission
Mission
Duranbah Public School is dedicated to helping every student to learn, grow, and succeed.
Location & Catchment Area
- Duranbah Public School
Nearby or Connected Schools
- A Cudgen Public School 4.8 km
- B Tumbulgum Public School 5.5 km
- C Terranora Public School 5.7 km
- D Kingscliff High School 5.8 km
Profile (2025)
- Total enrolments
- 56 (33 girls, 23 boys)
- Enrolments (FTE) What does this mean?
- 56
- ICSEA What does this mean?
- 1058 (percentile 71)
- SEA quarters What does this mean?
- 14% / 30% / 30% / 26%
- FOEI What does this mean?
- 57
- Teaching staff (FTE) What does this mean?
- 4
- Non-teaching staff (FTE) What does this mean?
- 1.4
Enrolments by grade (2025)
| Grade | Headcount |
|---|---|
| Kindergarten | 7 |
| Year 1 | 7 |
| Year 2 | 6 |
| Year 3 | 12 |
| Year 4 | 8 |
| Year 5 | 11 |
| Year 6 | 5 |
| Total | 56 |
Year by year
Attendance data for 2020 is unavailable — NSW schools were disrupted by COVID-19 and the Department of Education did not publish figures for that year.
| Year | Enrolments | Girls | Boys | Attendance % | ICSEA | Teaching staff (FTE) |
|---|---|---|---|---|---|---|
| 2025 | 56 | 33 | 23 | - | 1058 | 4 |
| 2024 | 64 | 33 | 31 | 90.9 | 1053 | 4 |
| 2023 | 65 | 32 | 33 | 91.2 | 1057 | 4 |
| 2022 | 65 | 34 | 31 | 88.6 | 1060 | 4 |
| 2021 | 58 | 29 | 29 | 91.5 | 1031 | 3.8 |
| 2020 | 60 | 29 | 31 | - | 1042 | 3.8 |
| 2019 | 57 | 27 | 30 | 89.4 | 1039 | 3.7 |
| 2018 | 52 | 23 | 29 | 89.4 | 1014 | 3.7 |
| 2017 | 41 | 19 | 22 | 91.9 | 964 | 2.5 |
| 2016 | 25 | 13 | 12 | 95.1 | 899 | 2.4 |
| 2015 | 26 | 11 | 15 | 91 | 901 | 2.4 |
| 2014 | 30 | 12 | 18 | 94.2 | 898 | 2.4 |
| 2013 | 34 | 14 | 20 | 92.2 | 976 | 2.4 |
| 2012 | 32 | 13 | 19 | 93.3 | 1011 | 2.4 |
| 2011 | 25 | 8 | 17 | 91.7 | 1002 | 2.4 |
| 2010 | 32 | 11 | 21 | - | 1002 | 2.4 |
| 2009 | 35 | 14 | 21 | - | 1010 | 2.4 |
| 2008 | 37 | 12 | 25 | - | 1010 | 2.4 |
Attendance data for 2020 is unavailable — NSW schools were disrupted by COVID-19 and the Department of Education did not publish figures for that year.